Figure 2.
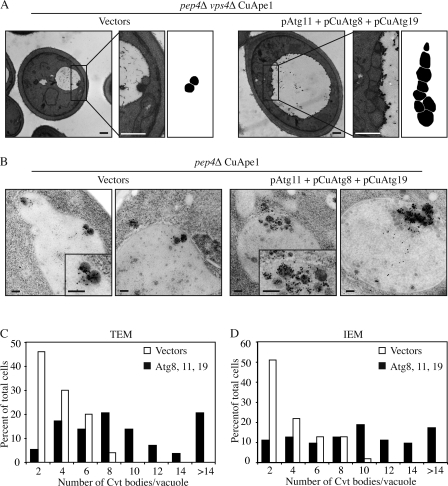
More Cvt vesicles were formed in Atg11-overexpressing cells. Cells (pep4Δ vps4Δ CuApe1; JGY089) expressing either pAtg11, pCuAtg8, and pCuAtg19 or empty vectors were cultured in SMD medium to mid-log phase. Cells were harvested and prepared for EM as described in Materials and methods. Representative images of TEM and IEM are shown in A and B, respectively. Areas with typical Cvt vesicles are shown with higher magnification at the right. In A, the Cvt vesicles were drawn in black in the far right. Bars: (A) 500 nm; (B) 200 nm. (C and D) Quantification of Cvt body accumulation. The number was determined from cells with clearly defined Cvt bodies inside the vacuole.

