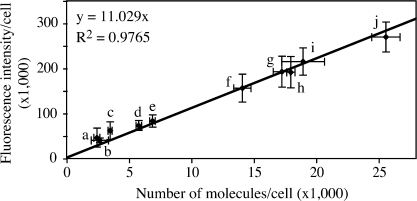
Figure 3.
Linear relationship between GFP-tagged protein amount and fluorescence intensity. The standard curve showed the relationship between protein amount and fluorescence intensity. Fluorescence intensity and GFP-tagged protein amount were quantified in the following strains: (a) PATG27GFP-Atg8; (b) Mlc2-GFP; (c) PATG27GFP-Atg8 pep4Δ; (d) PVPS30-ATG18GFP-Atg8; (e) PVPS30-ATG18GFP-Atg8 pep4Δ; (f) PATG3GFP-Atg8; (g) PATG3GFP-Atg8 pep4Δ; (h) PATG8GFP-Atg8; (i) Cdc12-GFP; and (j) PATG8GFP-Atg8 pep4Δ. Error bars indicate the SD of three independent experiments. For fluorescence intensity, >200 cells of each strain were analyzed by microscopy as described in Materials and methods. Linear regression was performed to generate the formula y = 11.029x.

