Figure 4.
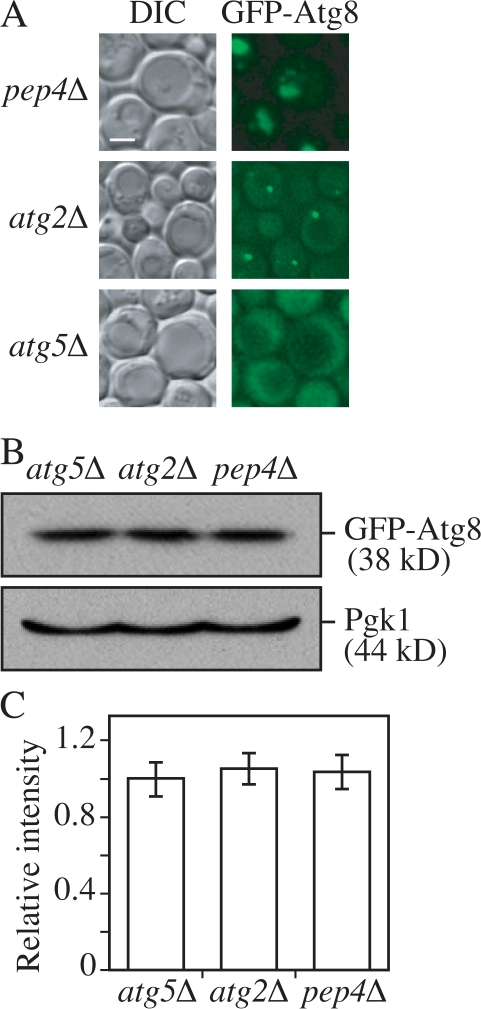
Localization patterns do not affect the linearity of the fluorescent signal. (A) Representative images of GFP-Atg8 localization in pep4Δ, atg2Δ, and atg5Δ strains, which result in autophagic body, PAS, and diffuse cytosolic staining patterns, respectively. GFP-Atg8 pep4Δ (YZX254), GFP-Atg8 atg2Δ (JGY054), or GFP-Atg8 atg5Δ (JGY053) cells were starved for 2 h and examined by fluorescence microscopy. Bar, 2 μm. (B) The protein amount of GFP-Atg8 was the same in the pep4Δ, atg2Δ, or atg5Δ backgrounds. The amount of Pgk1 protein in each strain was used as a loading control. (C) Relative fluorescence intensity of GFP-Atg8 per cell in pep4Δ, atg2Δ, and atg5Δ strains (n = 60). Images of all of these strains were quantified as described in Materials and methods. The intensity of GFP-Atg8 in the atg5Δ strain was normalized to 1 as a reference. Error bars indicate the SEM of three independent experiments.

