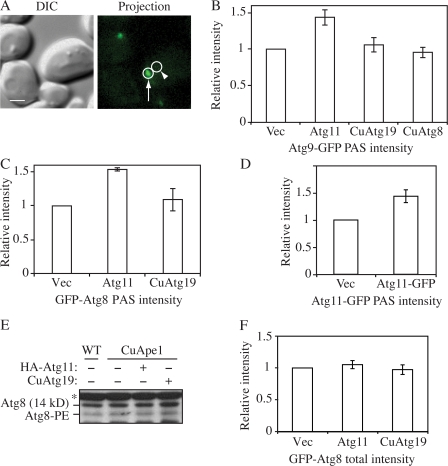
Figure 5.
Effect of Atg11 overexpression on the PAS intensity of Atg8 and 9. (A) On the 2D projection image, circles were drawn around the PAS (arrow) and the adjacent cytosolic region (arrowhead) as background. The difference between these two regions was recorded as the PAS intensity. Bar, 2 μm. (B) The CuApe1 Atg9-GFP strain (JGY072) expressing pHA-Atg11, pCuAtg8, or pCuAtg19 was cultured in SMD medium and examined by microscopy (n = 80). (C) CuApe1 atg8Δ cells (JGY071) harboring pGFP-Atg8 together with pHA-Atg11, pCuAtg19, or empty vector were cultured in SMD medium and examined by microscopy (n = 80). (D) Increase of Atg11-GFP intensity at the PAS in Atg11 overexpression cells. The CuApe1 Atg11-GFP strain (JGY087) transformed with empty vector or pAtg11-GFP was grown in SMD media and the PAS intensity of Atg11-GFP was analyzed by microscopy (n = 80). (E) Overexpression of Ape1 or Atg11 did not induce lipidation of Atg8. Wild-type (SEY6210) cells or the CuApe1 strain (JGY069) expressing pHA-Atg11 or pCuAtg19 were cultured in nutrient-rich medium, and a protein extract was resolved by SDS-PAGE and examined by Western blot with anti-Atg8 antiserum. The asterisk marks a nonspecific band. (F) The total GFP-Atg8 signal was not affected by the increase of Atg11. The same strains as in C were used, but instead of measuring the signal at the PAS, the GFP-Atg8 intensity of the whole cell was measured (n = 60). The relative intensity of cells expressing empty vector was set to 1 as reference, and error bars indicate the SEM of three independent experiments.

