Figure 7.
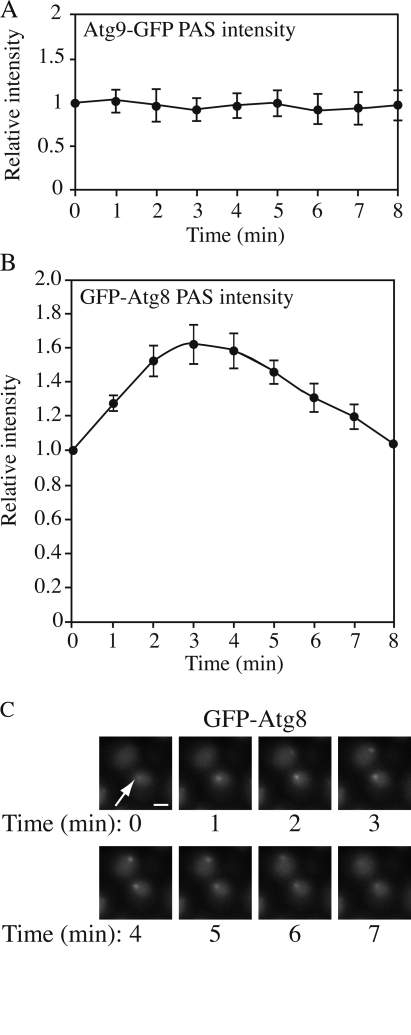
Kinetics of Atg proteins at the PAS during autophagy. GFP-tagged strains were starved for 2 h and analyzed by microscopy. (A) For Atg9-GFP, the PAS intensity remained as a relative constant for 30 min, but only nine time points are shown. Fluorescence intensity at time 0 was normalized to 1 (n = 9). Essentially the same results were seen for Atg1-, Atg11-, Atg16-, Atg17-, and Atg19-GFP. (B) For GFP-Atg8, the PAS intensity changed over time. The time point at which the punctate structure could first be seen was set as time 0 and fluorescence intensity at this time point was set to 1 (n = 11). In A and B, all data points came from three independent experiments and error bars indicate the SEM. (C) Representative images of GFP-Atg8 showing the change of PAS (arrow) intensity. Bar, 2 μm.

