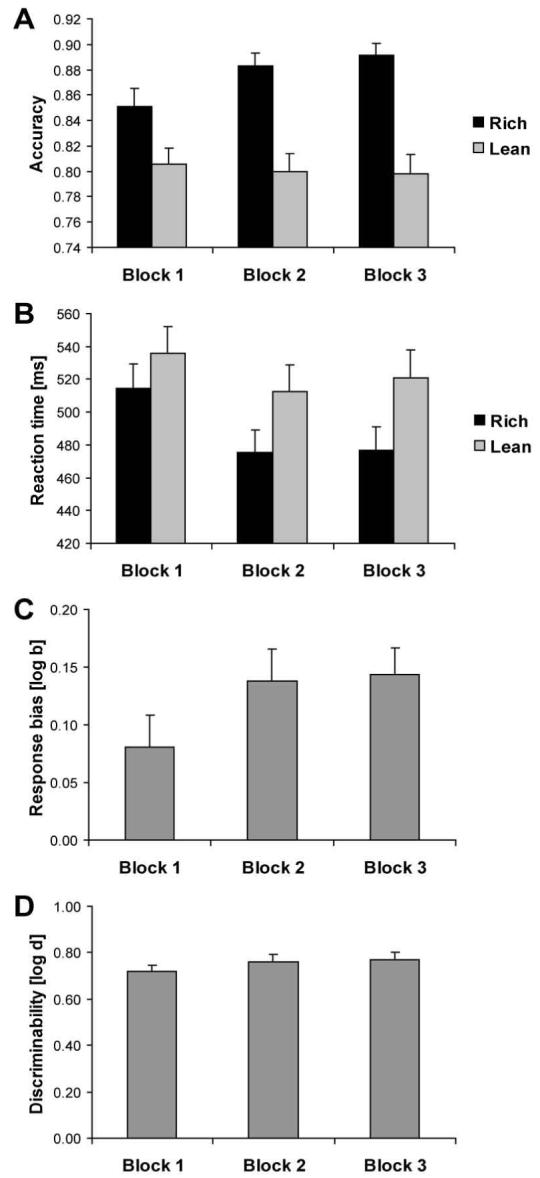
Figure 2.

Overall effect of task manipulation. Mean accuracy (A), reaction time (B), response bias (C), and discriminability (D) for the entire sample (n = 62). Error bars represent standard errors. For accuracy and RT, the rich condition (black bars) refers to the stimulus associated with more frequent reward, whereas the lean condition (light gray bars) refers to the stimulus associated with less frequent reward.
