Figure 3.

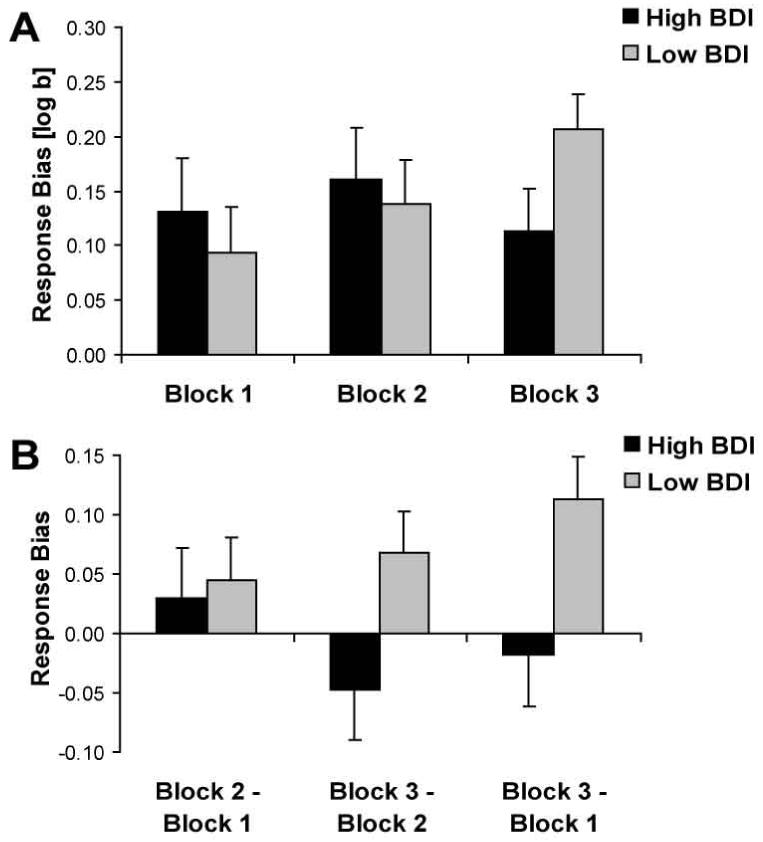
Mean response bias (A) and (B) changes in response bias for high (black bars; n = 15) and low (light gray bars; n = 21) BDI subjects. Error bars represent standard errors.

Mean response bias (A) and (B) changes in response bias for high (black bars; n = 15) and low (light gray bars; n = 21) BDI subjects. Error bars represent standard errors.