
Fig. 4.
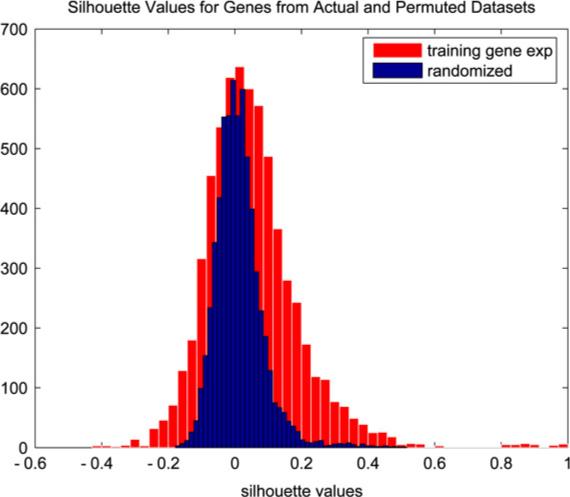
Permutation null distribution (blue) and distribution of gene silhouette values from run 1 (red). (For interpretation of the references to colour in this figure legend, the reader is referred to the web version of this article.)
Official websites use .gov
A
.gov website belongs to an official
government organization in the United States.
Secure .gov websites use HTTPS
A lock (
) or https:// means you've safely
connected to the .gov website. Share sensitive
information only on official, secure websites.
Permutation null distribution (blue) and distribution of gene silhouette values from run 1 (red). (For interpretation of the references to colour in this figure legend, the reader is referred to the web version of this article.)