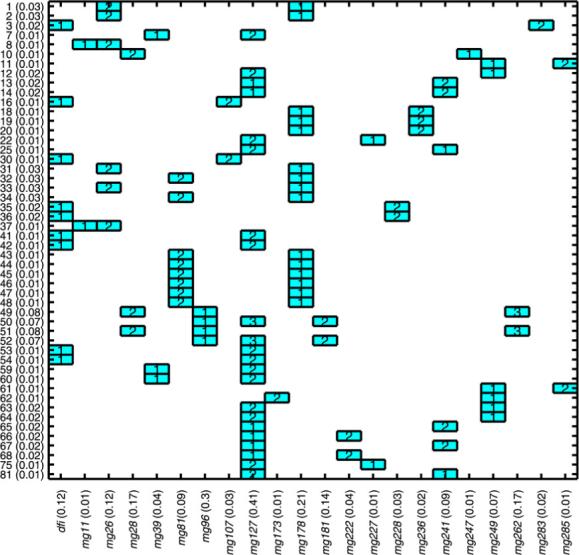
Fig. 7.

Summary of split variables and corresponding split levels for top trees in run 4. Vertical axis shows tree indices and tree weights; horizontal axis shows each split variable and sum of probabilities of trees in which variable occurs (importance weight).
