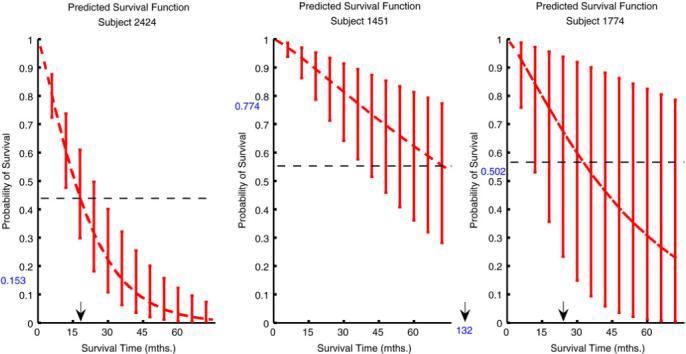
Fig. 9.

Predicted disease-free survival curves with uncertainty intervals at chosen time points for three individuals. The ROC cutoff (dashed line) for classification as short-term or long-term survivor and the prediction of survival at 3 years (blue number on the y-axis) are identified. The actual survival time is marked with an arrow on the x-axis. (For interpretation of the references to colour in this figure legend, the reader is referred to the web version of this article.).
