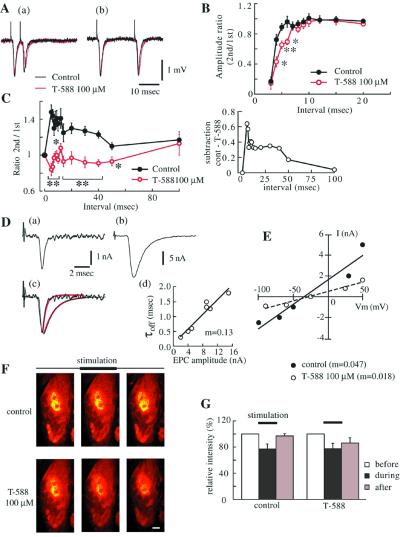
Figure 3.
T-588 in mice neuromuscular junction. (A) Presynaptic spike amplitude reduction induced by paired-pulse stimulation at different intervals (a) 5 msec, (b) 20 msec in the presence of 100 μM T-588. Presynaptic perineurial currents are shown as averaged waveforms from 16 successive traces. (B) Presynaptic current amplitude ratio induced by paired-pulse stimulation with various intervals in control and 100 μM T-588. Data are shown as mean with SE from five experiments. Control data were taken after washing out of T-588. *, P < 0.05; **, P < 0.01 paired t test. (C) Synaptic facilitation induced by paired-pulse with various intervals in control and 100 μM T-588. (Left) The ratio of second EPP/first EPP are shown as facilitation indexes at each interval. The subtracted values (T-588 to control) are shown (Right). *, P < 0.05; **, P < 0.01 Student’s t test or Aspin-Welch test subsequent to F-test. (D) Nerve evoked EPCs (average of 32) 50 μM T-588 (a) and washout (45 min) (b). Waves were superimposed after normalization (c). The red lines show first-order exponential curves fitted to the off time course in each current (membrane held at −40 mV) (d). The relationship between decay time constant (off) and maximum value of averaged currents recorded during the washout of T-588. Data obtained at 5, 10, 15, 20, 30, and 45 min washout. (a and b) 0 and 45 minutes of washout, respectively. Experiments were done in 0.8 mM Ca2+/1.5 mM Mg2+ and μ-conotoxin GIIIB (2 μg/ml) to avoid contraction. (E) Current-voltage relationship of the mEPCs recorded at the same motor nerve terminal before (●) and 30-min superfusion of 100 μM T-588 (○). Data are fitted to a linear function. The slope value (m) is shown. (F) Ca2+ uptake during tetanic stimulation. Fura-2 AM loaded from extracellular melieu. Images were captured from brightest plain of the terminal before, during, and after terminate of tetanic stimulation (20 Hz). Fluorescence intensity of Fura-2 decreased with Ca2+ concentration increase. Scale bar represents 2 μm. (G) Fluorescence intensity of unit area measured from captured image with National Institutes of Health image. Data are shown as mean value with SE from five experiments. No significant difference was observed between control and T-588 on relative intensity during stimulation (paired t test).

