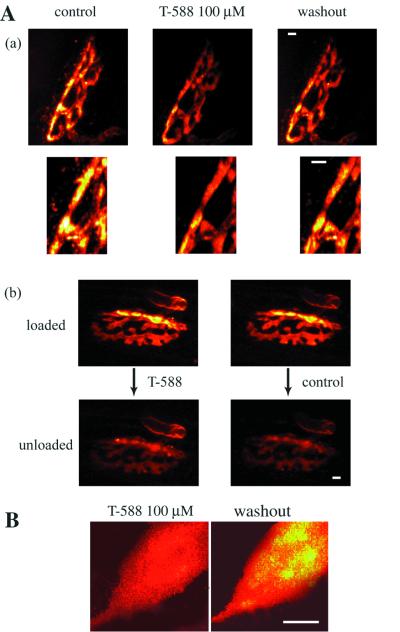
Figure 4.
Two-photon microscopy imaging of FM 1–43 to determine synaptic vesicle endocytosis in crayfish and mice. (A) (a) The fluorescence image of mice motor nerve terminal-loaded FM 1–43 with tetanic stimulation in the presence of 100 μM T-588. Dye loading was repeated after washing out of T-588. Images were captured every 1-μm step in the Z direction and accumulated. The brightest images in the terminal are shown expanded in the lower column. (b) After full loading of FM 1–43, the preparation was treated with 100 μM T-588 for 30 min and then destained by tetanic stimulation (20 Hz, 10 min) without dye in the bath in the presence of T-588. The same set of experiments was repeated without T-588. (B) Fluorescence image of crayfish motor nerve terminal-loaded FM 1–43 with tetanic stimulation. Dye loading was repeated with 100 μM T-588 and washing out of T-588 after taking under control condition. Scale bar in each image represents 2 μm.

