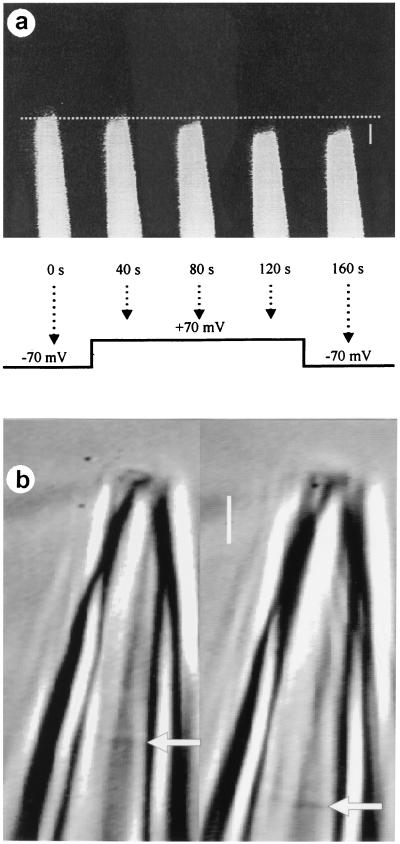
Figure 1.
Depolarization-induced displacement of the membrane patch. (a) Fluorescent images of a patch pipette containing fluorescein dye to delimit the membrane patch shows depolarization-induced displacement of the membrane patch. The arrows indicate the points in time during the voltage step protocol when the images were obtained. The data were obtained from an on-cell patch on a Xenopus oocyte with a borosilicate glass pipette. (Bar = 4 μm.) (b) Depolarization-induced displacement of an excised membrane patch from a cultured hippocampal neuron. Depolarization of the membrane from −50 mV to +50 mV for 60 s induced 2.6-μm displacement of the patch membrane. The displacement of the membrane is shown before (Left) and after (Right) the voltage step. Arrows indicate the membrane patch. A borosilicate glass pipette was used. (Bar = 2 μm.)

