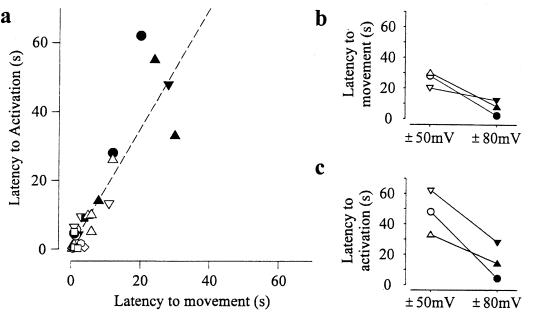
Figure 3.
Correlation between depolarization-induced membrane displacement and channel activation. (a) Plot of the latency to the onset of movement of the membrane patch vs. the latency to the onset of channel openings. Latency is measured from the time of the voltage step. The linear regression (dashed line) had a correlation coefficient of 0.88 and a slope of 1.6, indicating that activation follows movement. Data from each patch are indicated by a different symbol. Holding potentials ranged from −80 to −50 mV, and the voltage was stepped to voltages ranging from +50 to +80 mV. (b) Three different patches (indicated by different symbols) in which depolarization steps between both ±50 mV and ±80 mV were applied for each patch. The latency to both membrane movement and channel activation was decreased with larger voltage steps. The latency to membrane movement was defined as the time from the onset of depolarization to the beginning of membrane movement. The beginning of movement was estimated by projecting a line drawn through the points between about 20% and 80% of the maximal movement to intercept the time axis. The latency to channel activation was defined as the time from the onset of depolarization to the beginning of channel activation and was estimated by using the same approach used for membrane movement. Borosilicate glass pipettes were used.

