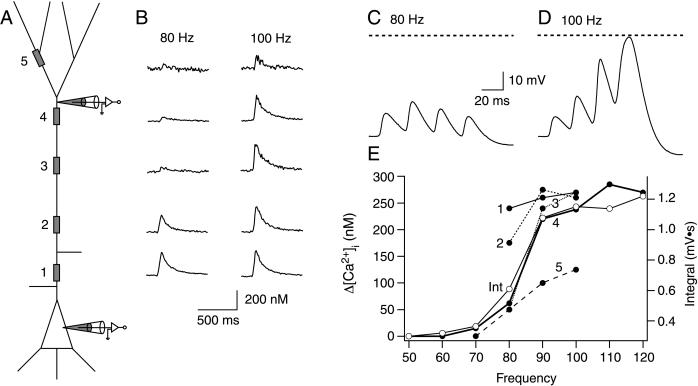
Figure 5.
Imaging dendritic calcium transients during high-frequency stimulation. (A) Schematic representation of an L5 pyramidal neuron showing the dendritic voltage recording at ≈600 μm from the soma and at the soma. The gray boxes indicate regions of interest chosen for imaging calcium fluorescence transients; regions 1–5 were 50, 200, 400, 600, and 800 μm from soma, respectively. (B) Dendritic [Ca2+]i transients evoked by four somatically elicited APs below the critical frequency (80 Hz, Left) and above the critical frequency (100 Hz, Right). The traces are placed beside the corresponding recording sites shown in A. Electrical response recorded at the dendritic pipette at 80 Hz (subcritical) (C) and 90 Hz (supra-critical) (D). The dashed lines represent 0 mV. (E) Peak Δ[Ca2+]i recorded in the each of the five regions shown in A (●). The time integral (Int) of the voltage response recorded at the dendritic site is also shown (○). Its frequency dependence corresponds closely to that of Δ[Ca2+]i recorded at region 4 (closest to the dendritic recording pipette).

