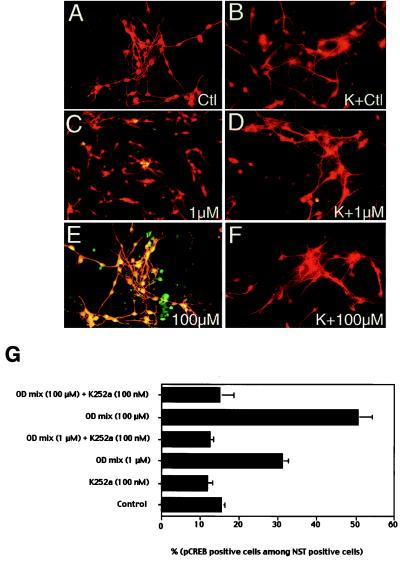
Figure 2.
Double immunofluorescence with anti-pCREB and anti-NST in primary cultures of ORNs treated with odorants. (A–F) Primary cultures were incubated with MEM/d-Val for 1.5 hr and then switched to medium (A, C, and E) or medium containing 100 nM K252a (B, D, and F) for 30 min before odorant stimulation. Concentrations of odorant mixtures that were applied for 15 min are indicated in each panel. K, K252a preincubation. pCREB and NST were visualized by immunofluorescence. pCREB was localized by fluorescein-conjugated anti-rabbit Ab (green) and NST was localized by rhodamine-conjugated anti-mouse Ab (red). Colocalization is visualized as yellow. (G) Quantitative analyses of odorant (OD)-induced pCREB increase in ORNs. Relative pCREB immunoreactivity indicates pCREB-positive cells among NST-positive cells. Cells were counted from at least six randomly selected areas of each slide from three independent experiments. SEM is represented as line bars.

