Figure 1.
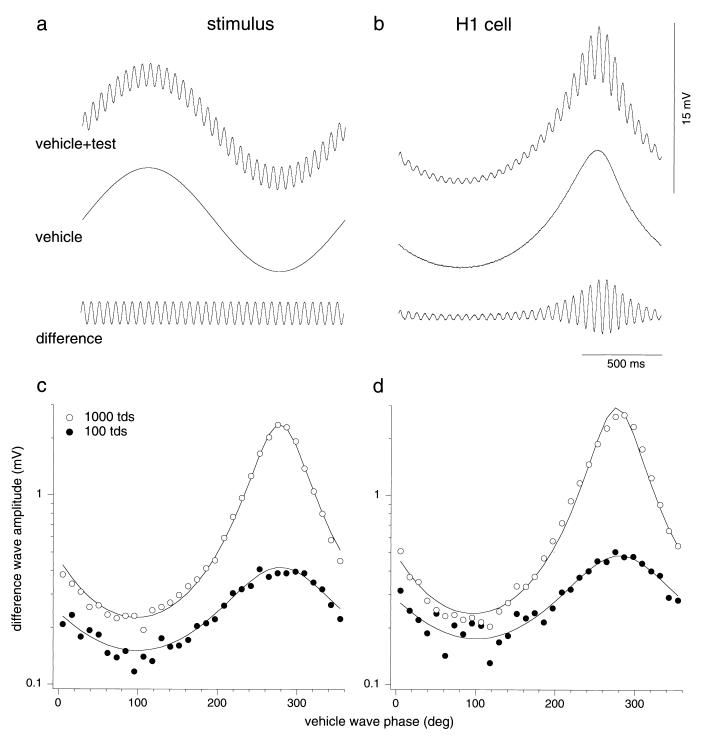
(a) The light stimulus applied to the retina was a temporal waveform (Top) created by adding a high-frequency (19.52-Hz), low-amplitude test wave (Bottom) to a low-frequency (0.61-Hz), high-amplitude vehicle wave (Middle). Mean illuminance was 1,000 tds, and the contrast of the vehicle wave was 0.85. (b) HI horizontal cell response to luminance stimuli (5° field). (Top) Combined-wave response. (Middle) Response to vehicle wave alone. (Bottom) The difference wave obtained by subtraction. The test response varied with vehicle-wave phase. (c) First-harmonic amplitude of each cycle of the difference-wave response shown in b is plotted against vehicle-wave phase at 1,000 tds (○) and 100 tds (●). Solid lines show fit of the data by the inverse sine equation r = A/(BCsin(ΦM + Φlag) + 1), where ΦM is the vehicle-wave phase and C is vehicle-wave contrast. Free parameters are A, which is an overall scaling parameter, B, which scales the sine wave amplitude and is a measure of the degree of adaptation, and Φlag, representing an adaptation delay. (d) Equivalent data for a second H1 cell. At 1,000 tds the mean value of B was 0.77 (n = 32, SD = 0.14) and the mean Φlag corresponded to a delay of 41.4 msec (n = 32, SD = 0.14 msec). At 100 tds the mean value of B was 0.46 (n = 16, SD = 0.11) and the mean Φlag corresponded to a delay of 59.0 msec (n = 16, SD = 0.33 msec). In separate experiments, test amplitude was found to be linearly related to contrast over the range tested (not shown).

