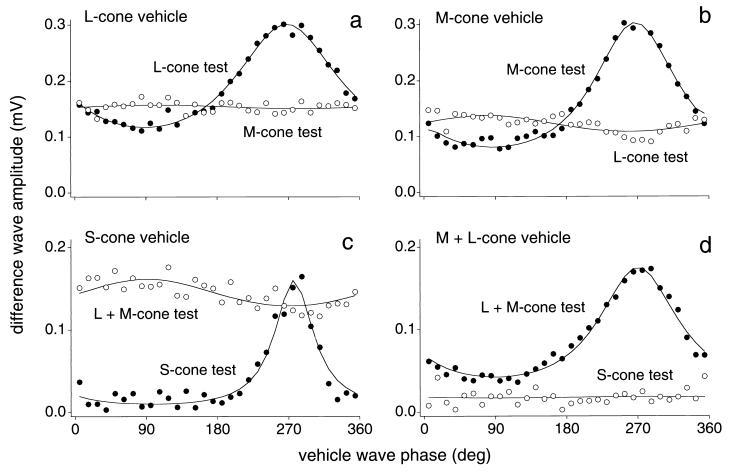
Figure 3.
HI and HII horizontal cell voltage response amplitudes to cone-isolating test waves plotted as a function of vehicle-wave phase (mean illuminance, 1,000 tds; 5° field). (a and b) Responses of an HI horizontal cell to cone-specific modulation. (a) L-cone vehicle-wave condition: L-cone test response amplitude varied with vehicle-wave phase (●) but M-cone test response did not (○). (b) M-cone vehicle-wave condition: M-cone test response amplitude varied with vehicle-wave phase (●) but L-cone test response did not (○). (c and d) Responses of an HII horizontal cell to cone-specific modulation. (c) S-cone vehicle-wave condition: S-cone test response amplitude varied with vehicle-wave phase (●) but (L+M)-cone test response did not (○). (d) (L+M)-cone vehicle-wave condition: (L+M)-cone test response amplitude varied with vehicle-wave phase (●) but S-cone test response did not (○). Solid lines are fits of equation given in the legend to Fig. 1.

