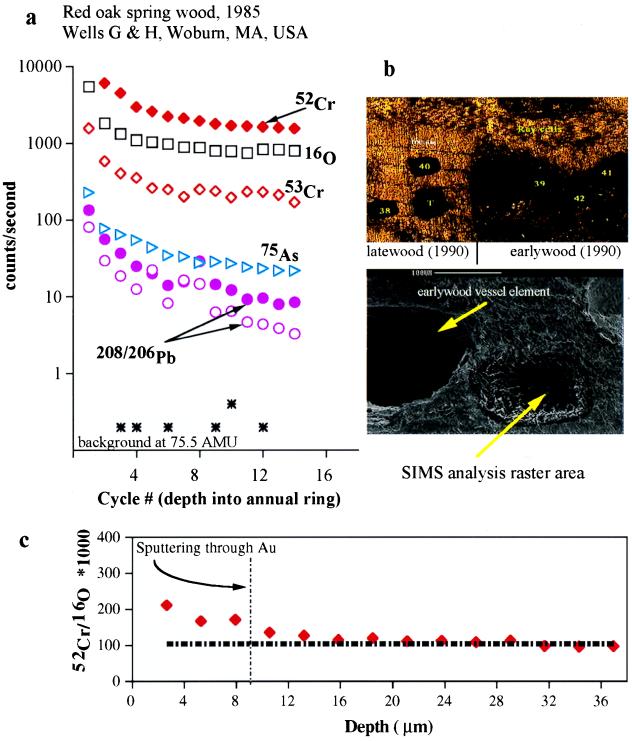
Figure 1.
Typical SIMS depth-profiling analysis. (a) All data are plotted as counts per second, except 52Cr and 53Cr, which, for clarity, are plotted as total counts collected during 20-s count periods. AMU, atomic mass units. (b) Optical and SEM photomicrographs illustrate spatial resolution of analyses with respect to xylem members. (c) Normalized 52Cr/16O ratios for the data presented in a. The first three analyses represent sputtering through the Au conductive coating, whereas the last six analyses are averaged to obtain representative metal/oxygen ratios denoted by the dashed horizontal line. Note cycle numbers from a have been converted to depth in micrometers (see Results and Discussion for details).

