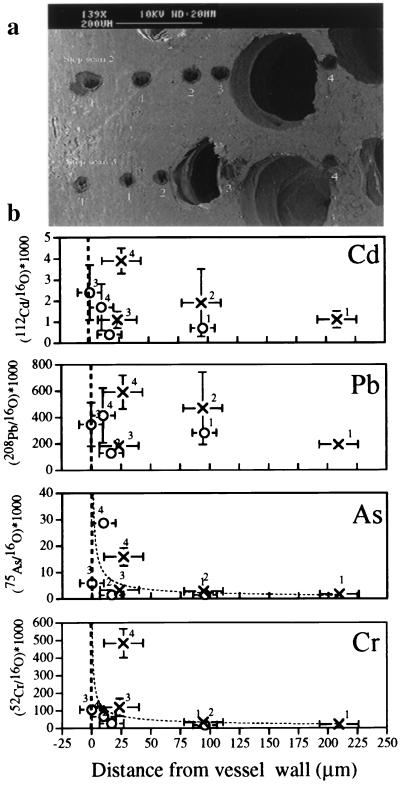
Figure 3.
SIMS step scan analyses. (a) SEM photomicrograph of spot analyses near vessel element in earlywood 1968. (b) Cd, Pb, As, and Cr ratios as a function of distance from the vessel wall. Note, two separate scans were made approaching different vessel elements within the same growth increment (× plot symbols indicate scan two, whereas ○ indicates scan three). Abscissa error bars are based on ion probe beam diameter, and ordinate error bars are based on the 1-σ variation about the mean of the cycles used to determine metal/oxygen ratio. Dashed lines for As and Cr are exponential curves fitted to the data.

