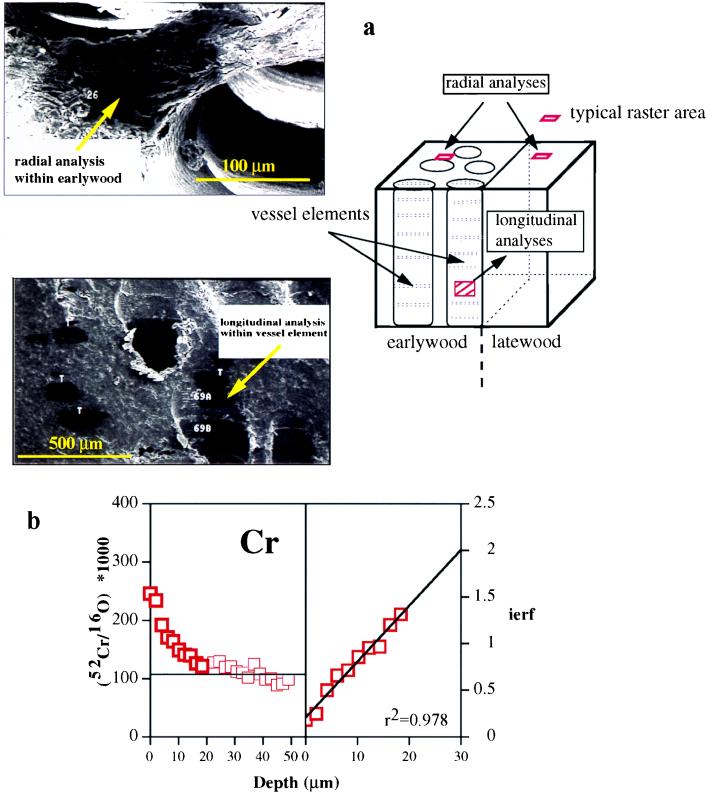
Figure 4.
SIMS in situ analysis geometries. (a) Analysis geometries as depicted by SEM photomicrographs in relation to schematic depiction of a single growth increment. (b) Cr SIMS depth profile analysis longitudinal to vessel element (Wells G & H, spring 1974, Woburn, MA). Depth into vessel wall increases along the x axis (total depth = 55 μm). The first two cycles of data were omitted as they represent sputtering through the Au conductive coating. Bold symbols are used to calculate values of the diffusion coefficient × time. Note the good fit to the inverse error function analysis (ierf).

