
Fig. 1.
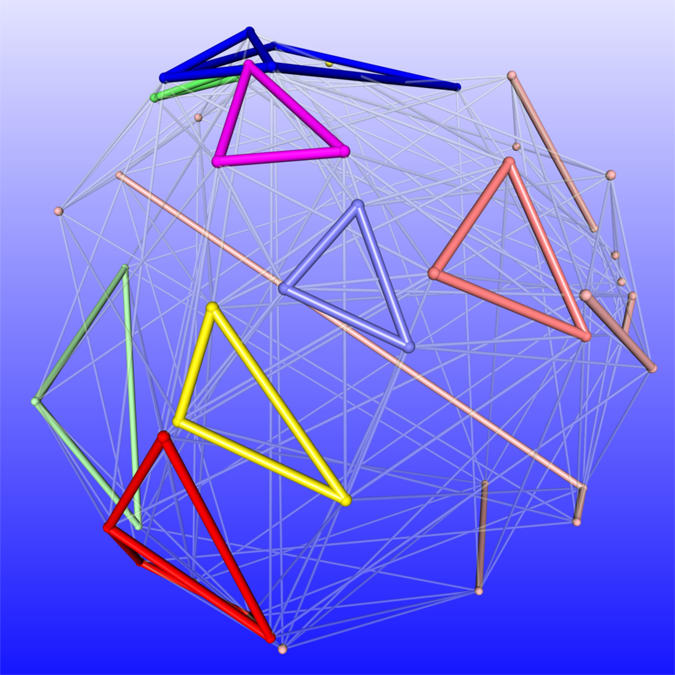
The codon graph. Each node of the graph represents 1 of the 48 distinguishable codons. Two nodes are linked if the corresponding codons differ in exactly one position, e.g., TTG and TTA. The amino acids obtained from the codons are color-coded, with the most prominent being leucine (red) and arginine (blue). The colored links denote reading errors that do not affect the result, whereas the transparent links show reading errors that would affect the result. The optimization problem consists in maximizing the ratio of colored links over noncolored ones while also maximizing the number of different colors. Note that distances are not important in the graph; what matters is only whether two nodes are connected.