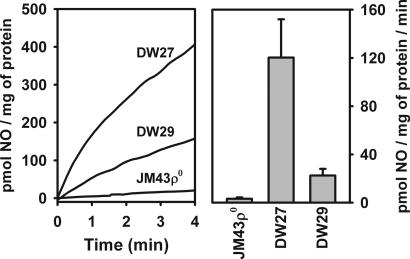
Fig. 2.
NO2−-dependent NO production by mitochondria from strains DW27, DW29, and JM43ρ0. (Left) Isolated mitochondria (400 μg/ml) were suspended in NO assay medium, which was prebubbled for 5 min with N2 to create anoxic conditions. After 5 min of prebubbling NaNO2 was added to 1 mM and NO production was measured with an NO polarographic electrode. (Right) Rates of NO2−-dependent NO production by mitochondria are normalized to the subunit V content of each strain shown in Left. Mean and standard deviation values are for three independent measurements.

