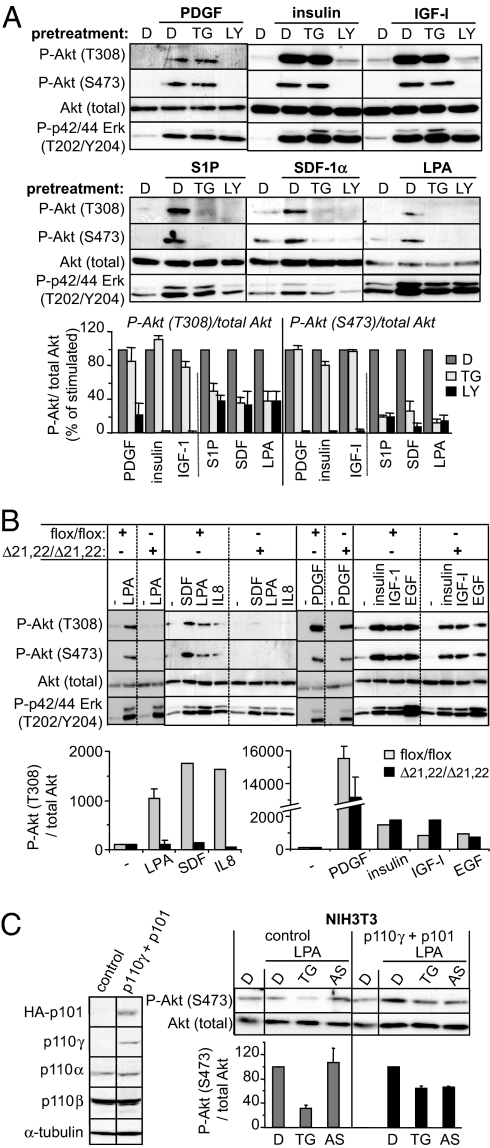
Fig. 3.
Role of p110β and p110γ in cell signaling in fibroblasts. (A) (Top and Middle) Starved NIH 3T3 cells were treated for 1 h with TGX-155 (TG; 1 μM), LY294002 (LY; 20 or 5 μM), or vehicle DMSO (D) followed by stimulation for 10 min with the indicated ligands. Total cell lysates were immunoblotted with the indicated Abs. A representative immunoblot is shown. (Bottom) Quantification of three independent experiments was performed, and data are presented as percentage of ligand-induced P-Akt/total Akt. (B) Starved MEFs of indicated genotype were stimulated with indicated stimuli for 10 min and immunoblotted with the indicated Abs. A representative experiment performed with MEFs isolated from different embryos is shown. (C) p110 isoform expression in NIH 3T3 cells transfected with empty vector (NIH 3T3 control) or p110γ and its regulatory subunit HA-p101 (p110γ + p101). Starved cells were treated for 1 h with TGX-155 (1 μM) or AS604850 (1 μM), followed by stimulation for 10 min with LPA and immunoblotting with the indicated Abs.

