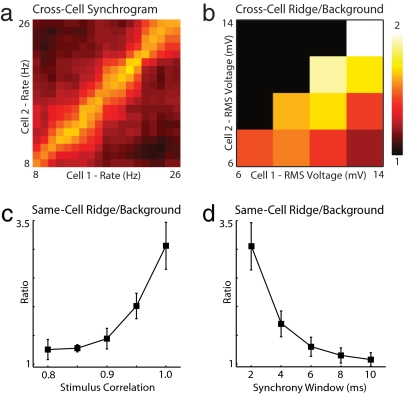
Fig. 4.
Robustness of pairwise rate-specific synchrony. (a) Cross-cell synchrograms were generated by comparing stimulus epochs from two different neurons. In this example, the horizontal and vertical axes now index-separate neurons presented with identical noisy gamma stimuli (Fc = 30 Hz, Fw = 30 Hz, and Arms = 50%). (b) Mean cross-cell ridge/background synchrony is plotted as a function of the rms amplitude of evoked membrane potential fluctuations in each cell (n > 5, all pairs). This ratio decays as the difference in stimulus amplitude increases. When stimulus amplitudes are equal, the ratio increases with increasing stimulus amplitude. (c) Summary of same-cell ridge/background synchrony versus input stimulus correlation for experiments with Fc = 30 Hz, Fw = 30 Hz, and Arms = 50% (n > 5 at all correlations) analyzed by using a 2-ms synchrony window. In each experiment, a common gamma waveform was corrupted by summation with an independently generated gamma waveform during each epoch to yield a desired mean pairwise stimulus correlation across epochs (see Methods). (d) Summary of same-cell ridge/background synchrony versus synchrony window duration for all 23 experiments with Fc = 30 Hz, Fw = 30 Hz, and Arms = 50%. In this analysis, EPSP time constants ranged from 2–10 ms with a fixed threshold of 1.37.

