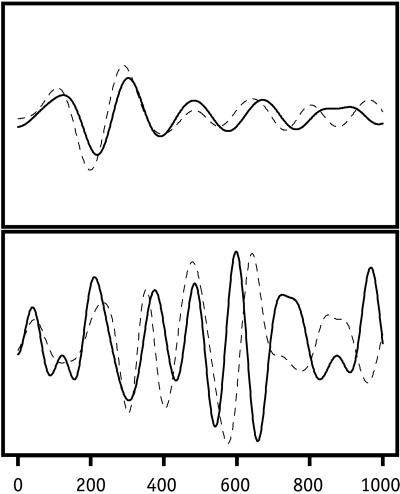
Figure 1.
Comparison of brain waves generated by visual images and auditory or visual words, experiment I. (Upper) The averaged, filtered brain waves for the visual image of a circle as prototype (solid curved line) and for the visual word circle as test sample (dotted line). (Lower) The same comparison for the brain waves generated by the visual image of a square (prototype) and the spoken word square (female speaker) as test sample. Because of the slightly slower brain-wave response to the auditory word, the test-sample wave was moved 50 ms to the left. The x axis is measured in ms after the onset of the image or word.

