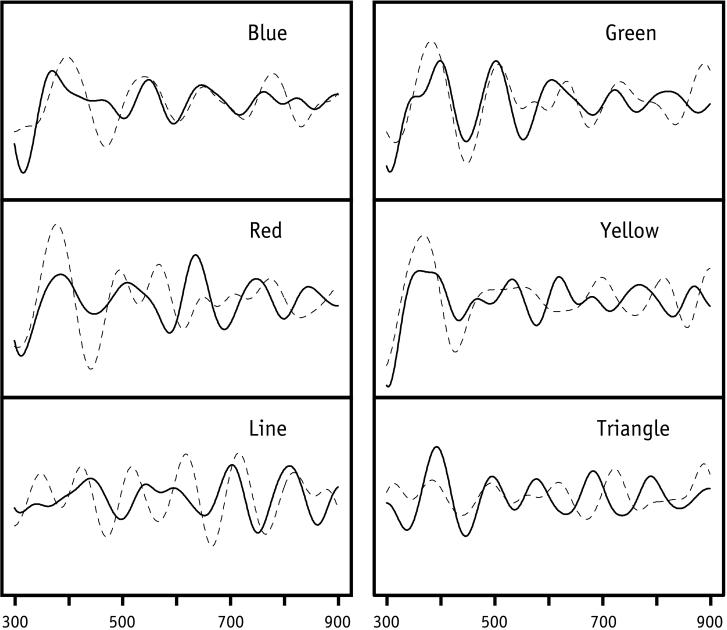
Figure 3.
Comparison of averaged and filtered brain waves generated by visual images and auditory words, experiment II. The six brain-wave prototypes (solid curved lines) were generated by the four color stimuli, named in the top four panels, and by the two visual shapes line and triangle in the bottom two panels. The test samples (dotted lines) were generated by the spoken names of the six visual stimuli averaged over both speakers. No translations along the x axis to improve the fit were made. The x axis is measured in ms after the onset of the visual image or its spoken name.

