Fig. 3.
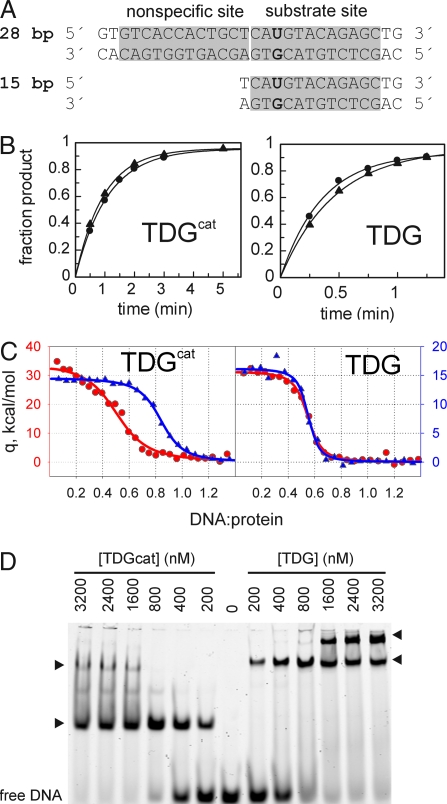
Enzyme kinetics and binding studies. (A) G·U-containing DNA substrates used for single-turnover kinetics. The 28-bp (G·U28) DNA contains the nonspecific binding site as seen in the crystal structure, but the 15-bp (G·U15) does not. The THF28 and THF15 used for ITC and EMSA are identical to G·U28 and G·U15, except that THF replaces dU. (B) Progress curves and fitted data from representative single-turnover kinetics for hTDGcat or hTDG (2.5 μM) acting on G·U28 (●) or G·U15 (▴) (250 nM). (C) Isothermal titration calorimetry data for hTDG or hTDGcat binding to THF28 (red, ●) or THF-15 (blue, ▴). Note carefully that the scale for THF28 data (red, left axis) is twofold greater than the scale for THF15 data (blue, right axis) to illustrate the near doubling of ΔH for binding THF28 relative to THF15. (D) EMSA was performed with 200 nM THF28 (6-FAM labeled) and the enzyme concentrations shown. Arrowheads indicate the apparent 1:1 (Lower) and 2:1 (Upper) protein:DNA complexes. The 2:1 complex for hTDGcat (23 kDa for monomer) has mobility similar to that of the 1:1 complex for hTDG (46-kDa monomer).

