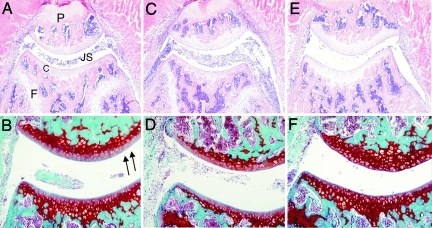
Fig. 3.
Joint pathology in Nod1 or Nod2 gene-deficient mice. (A and B) Knee joint of wild-type mouse, day 2 of SCW arthritis. The inflammatory cells in the joint cavity. (C and D) Nod1−/− mouse showing enhanced joint inflammation. (E and F) Nod2−/− mouse, showing the reduced inflammation in the knee joint. (A, C, and E) Hematoxylin/eosin staining, ×100 magnification. (B, D, and F) Cartilage PG depletion visualized by Safranin O staining (arrows indicate PG depletion), ×200 magnification. P, patella; F, femur; C, cartilage; JS, joint space.

