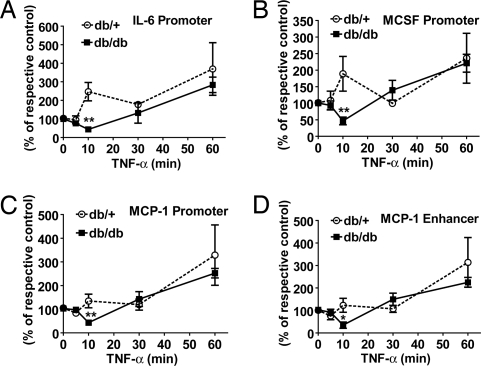
Fig. 4.
TNF-α stimulation leads to decreased HP1α recruitment in db/db VSMC. Levels of HP1α on promoters of IL-6 (A), MCSF (B), MCP-1 (C), and enhancer of MCP-1 (D) genes analyzed by ChIP assays using HP1α antibodies in VSMC stimulated with 10 ng/ml TNF-α for indicated time points. The line graph represents relative HP1α recruitment normalized to input expressed as the percentage of untreated control (mean ± SE,*, P < 0.05; **, P < 0.01 vs. TNF-α-treated db/+, n = 3).

