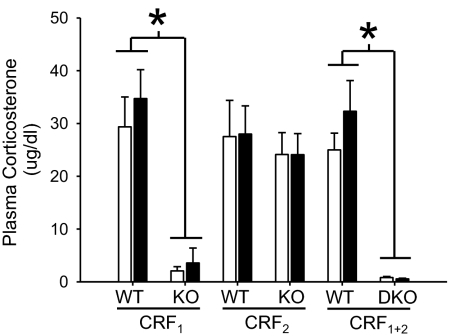
Fig. 2.
Plasma CORT after EtOH administration is blunted in CRF1 and CRF1 + 2 KO, but not in CRF2 KO mice. Shown is the concentration of CORT (mean ± SEM) in plasma samples taken 15 min after 1.5 g/kg EtOH. Open and filled bars represent animals pretreated with saline or EtOH, respectively, on days 1–10. *, main effect of genotype. Group sizes are as listed in the legend to Fig. 1.

