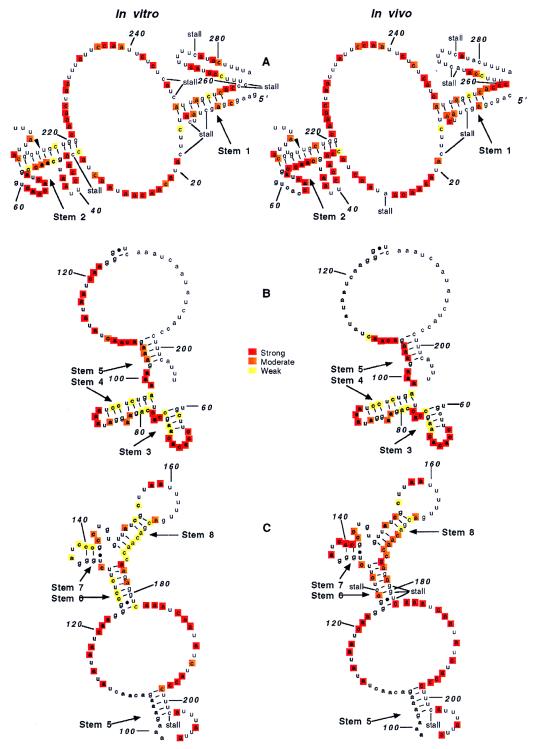
Figure 6.
MFA2 mRNA structure models showing DMS modification data. The three sets of models portray separately the modification results found and shown in Fig. 5. A shows the results of Fig. 5A and 5D, B shows the results of Fig. 5B, and C of Fig. 5C. The ranking of the extent of modification (strong, moderate, weak) was done by both visual comparisons of the intensity of bands (using weak for little or no modification and strong for modifications such as that of A and C residues in single-stranded loop regions) and by quantitative analysis of some of the gels using a Fuji phosphoimager.

