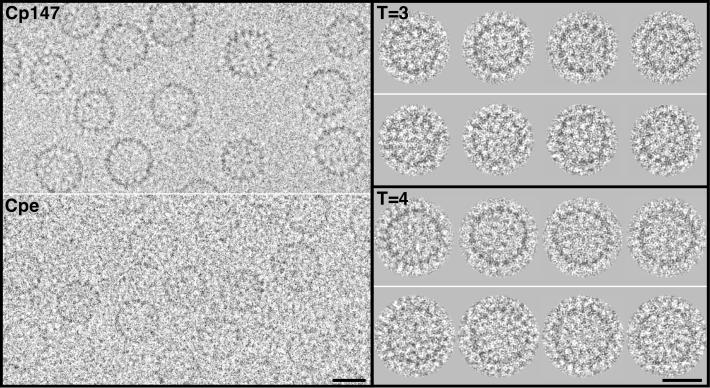
Figure 2.
(Left) Cryoelectron micrographs of Cp147 capsids and Cpe capsids. The capsids are of two sizes, with a higher incidence of larger (T = 4) capsids in the Cp147 preparation and of smaller (T = 3) capsids for Cpe. The Cpe micrograph was recorded closer to focus than the Cp147 micrograph, accounting for its lower contrast. (Upper Right) Gallery of four T = 3 capsids of Cp147 (upper row), compared with four Cpe capsids (lower row). (Lower Right) A similar comparison for T = 4 capsids. These images were obtained by computationally combining focal pairs and correcting for the contrast transfer function (Materials & Methods). As a result, the difference in contrast between the original micrographs (Left) was largely nullified. In this contrast transfer-function correction, the systematic attenuation of high frequencies (2) was not compensated, although this operation was performed in calculating the three-dimensional density maps. (Bars = 200 Å.)

