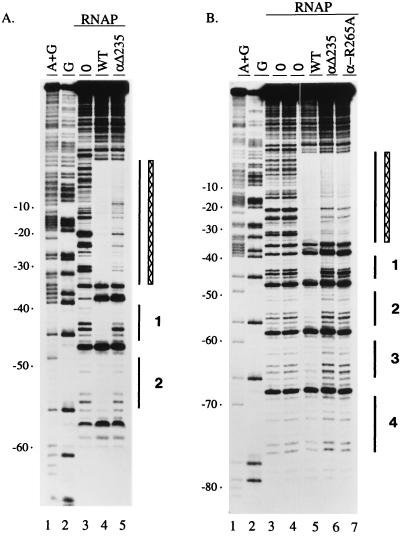
Figure 4.
DNase I footprints of complexes formed by (A) the two A-tract-rrnB P1 promoter or (B) the four A-tract-rrnB P1 promoter with wild-type RNAP (10 nM) or mutant RNAP (αΔ235 or R265A; each 32 nM). Control samples lacking RNAP (0) are in lanes 3 (in A and B) and 4 (in B). Regions fully or partially protected by wild-type RNAP (WT; vertical bars) and by α-mutant RNAPs (αΔ235 or αR265A; hatched boxes) are indicated. The phased A-tract-containing regions in the two A-tract promoter (A) are labeled 1 and 2, and in the four A-tract promoter (B) are labeled 1–4, where 1 represents the promoter proximal A-tract region (see Fig. 1 for sequences). A+G and G sequence markers were prepared as described in (40). Promoter fragments were 3′-end labeled in the bottom (template) strand at a site just upstream of the A-tract regions.

