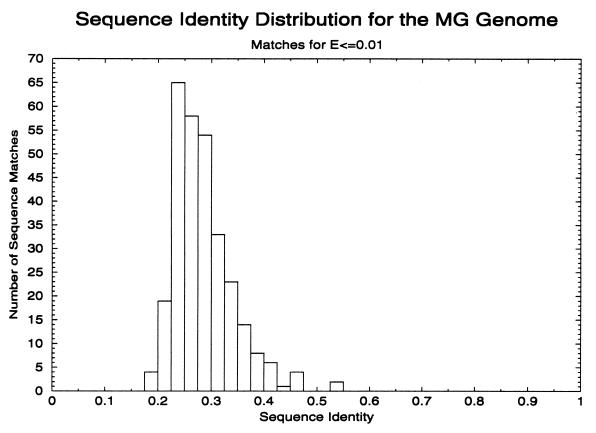
Figure 1.
Sequence identity histogram of all protein pairs in the MG genome that match at an E value of ≤0.01 by using fasta ktup = 1. Self matches are excluded. Most pairs of proteins match each other in the region below 30%, which is the region where the ability to detect relationships by pairwise sequence comparison programs drops off rapidly.

