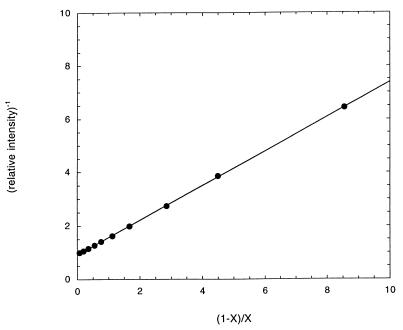
Figure 1.
Determination of D/H fractionation factor. Shown is a representative plot to determine the fractionation factor for the low field proton in chymotrypsin and N-AcLF-CF3 complex. The relative intensity of the low field signal is plotted as a function of the mole fraction H2O (X) according to Eq. 1. The slope is the D/H fractionation factor.

