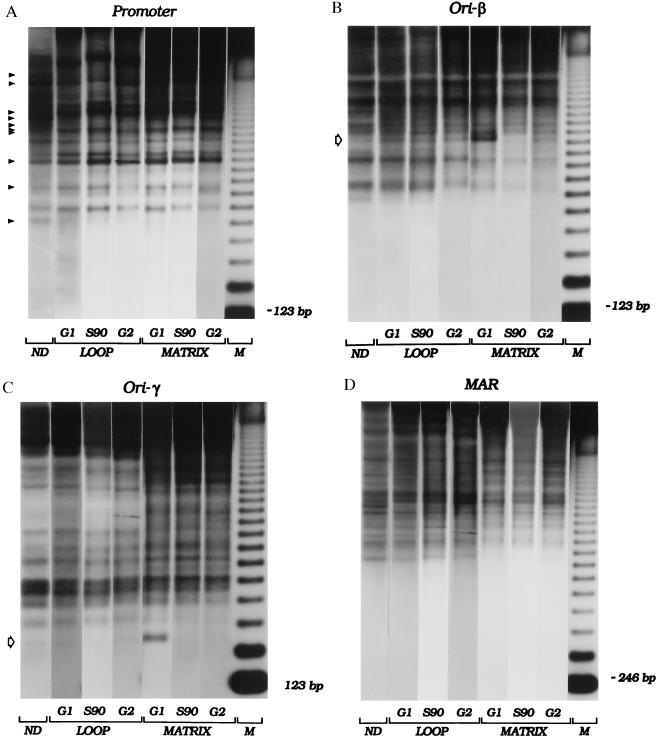
Figure 5.
Cell-cycle-dependent changes in chromatin architecture in matrix- associated and loop fractions. CHOC 400 cells were synchronized, and samples were taken before removal of mimosine (labeled “G1 ” in the figure), 90 min after drug removal (“S90” in the figure), or 13–14 hr after drug removal (representing a mixture of G2, mitotic, and early G1 cells; labeled “G2 ” in the figure). Isolated nuclei, in addition to a naked DNA control, were partially digested with micrococcal nuclease, and loop and matrix-associated DNA samples were purified, were digested with HindIII, and were separated on an agarose gel. After transfer to Hybond N+, the digests were hybridized sequentially with several end-labeled probes (see Materials and Methods and Results and Fig. 1). Panels labeled “Promoter”, “ori-β”, “ori-γ”, and “MAR” are autoradiographs obtained with probes 1.3R1, 38, 14, and 6, respectively. Naked (ND), and loop- and matrix-associated DNA samples are indicated. M, 123-bp ladder. Open arrows on the left sides of the ori-β and ori-γ panels indicate prominent hypersensitive sites present only at the G1/S boundary and only in matrix-associated chromatin.

