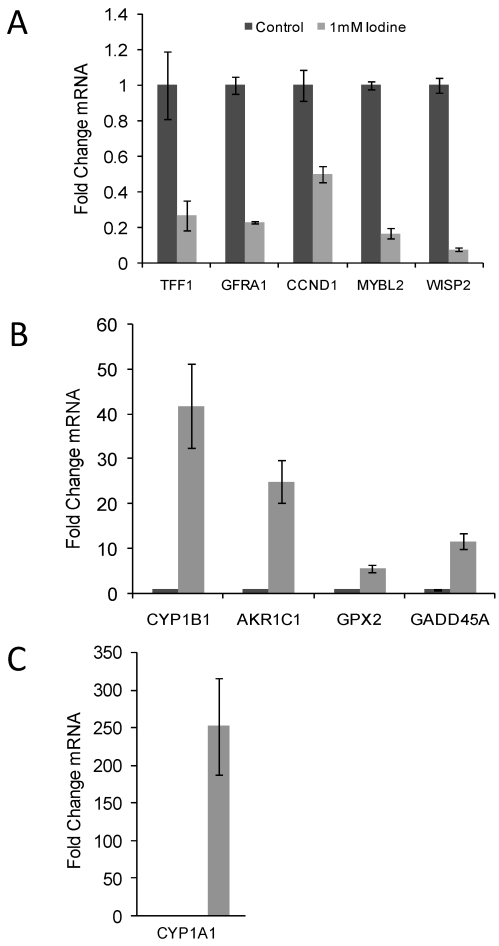
Figure 2.
Quantitative RT-PCR confirmed the changes in gene expression identified by microarray analysis. RNA was isolated from control cell and cells grown in the presence of 1 mM iodine for 48 hours. QRT-PCR analysis of genes predicted by microarray analysis to be down-regulated (A) and up- regulated (B & C) in response to iodine treatment. Cyclophilin A was used as control for normalization. All 10 genes showed significant changes (P < 0.03) in response to iodine treatment in concordance with the array data. The mRNA level in the control samples was set to 1 and the fold change is shown. In panel C control bar is not visible. Dark bars represent control samples while grey bars represent samples treated with 1.0 mM Iodine. Standard Deviation bars are shown.

