
Fig. 2.
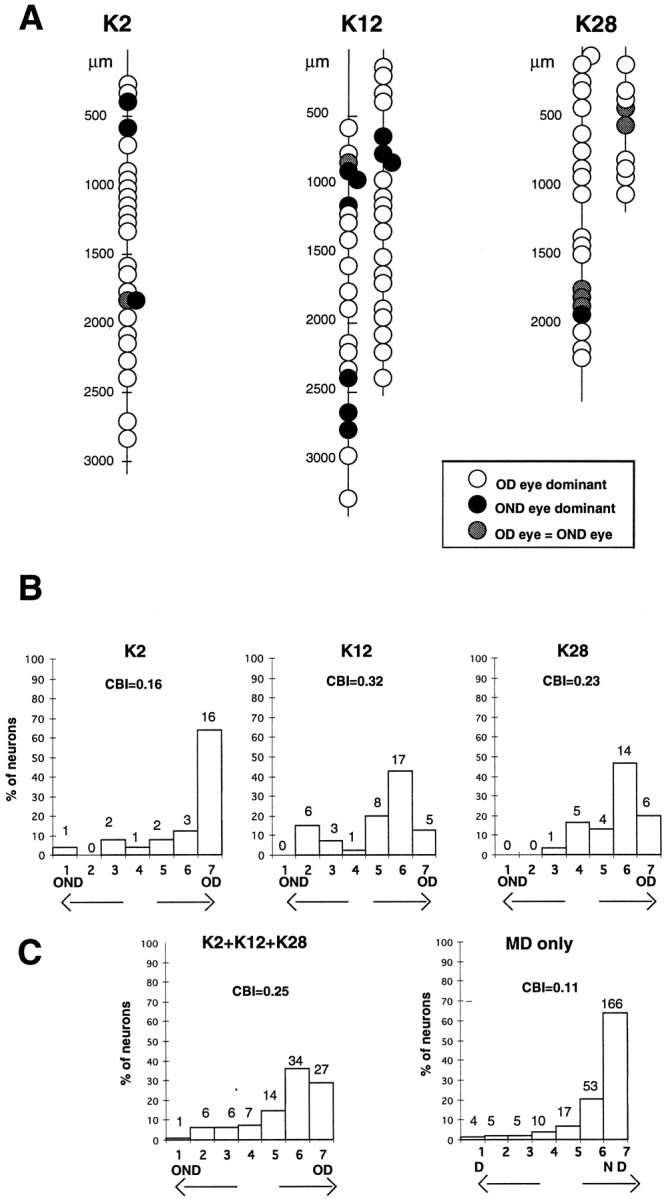
Single units recorded in vertical penetrations along the medial bank of the lateral gyrus in three reverse-sutured animals. A, Sketch of electrode tracks with the single units sequentially encountered is shown for each animal. The dominance of the OD or OND eye in activating each cell is indicated by differentshading. Most neurons were dominated by the OD eye; units dominated by the OND eye, or equally driven by both eyes, were encountered in clusters. B, Ocular dominance distribution for neurons recorded in each animal. C, Ocular dominance distribution for the entire sample of cells recorded in the three reverse-sutured animals (left) and for 260 cells recorded in seven MD kittens [from Reiter and Stryker (1988)]. The contralateral bias index (CBI) is indicated above each plot.