
Fig. 11.
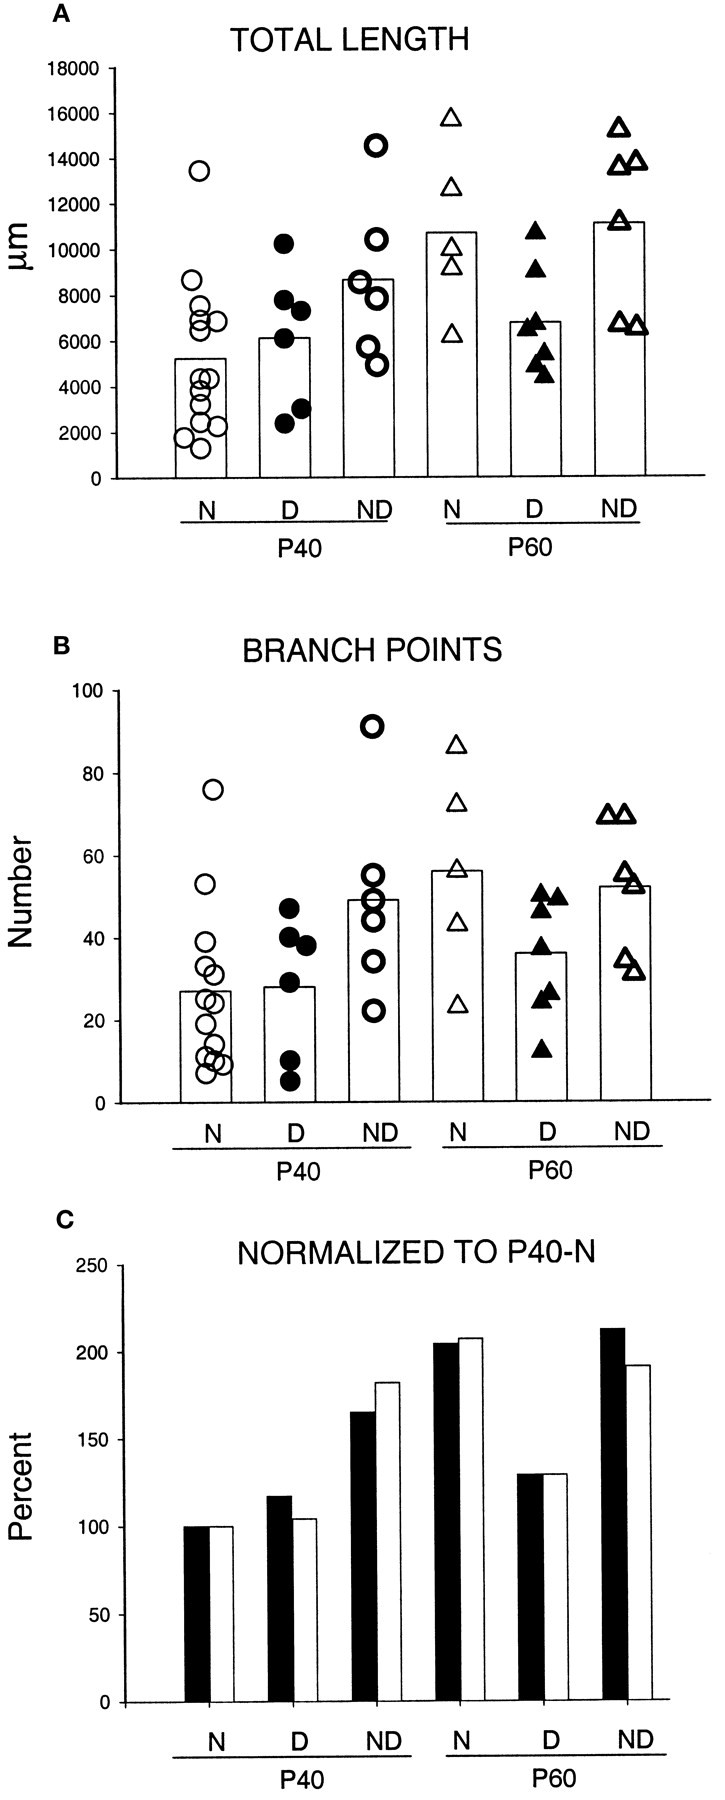
Scattergrams of the total length (A) and number of branch points (B) for arbors reconstructed in normal animals (N) and for both deprived (D) and nondeprived (ND) arbors reconstructed in MD animals. The age at perfusion is also indicated (P40 and P60). The white bar represents the mean value in each group. C, Values of total length (filled bars) and number of branch points (open bars) of arbors in the six experimental groups normalized relative to the mean values of arbors in normal arbors at P40.