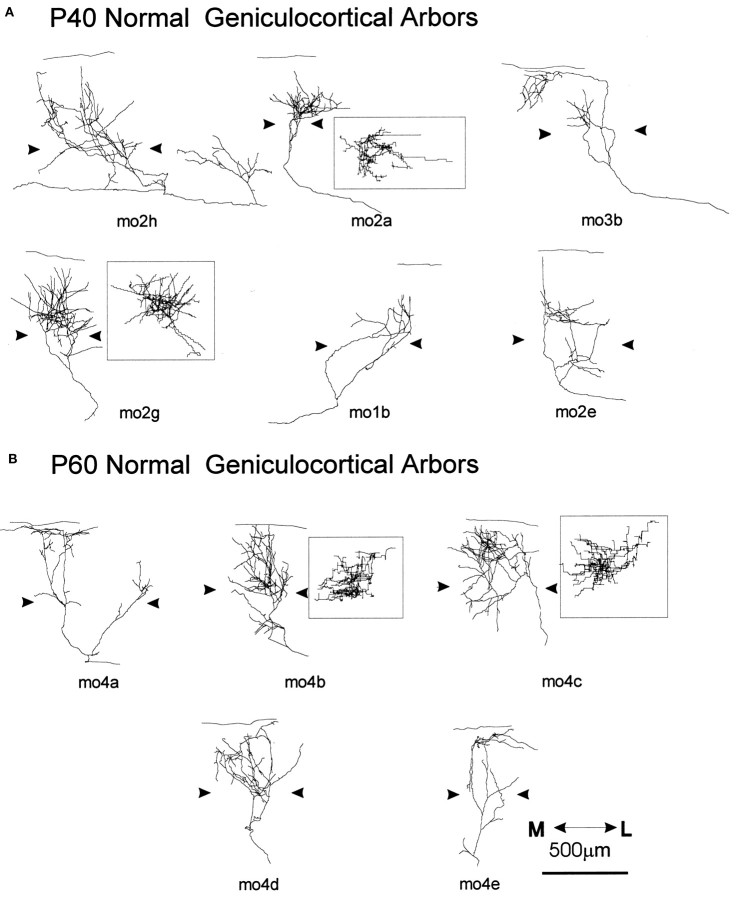
Fig. 8.
Computer reconstructions of geniculocortical arbors in area 17 comparing normal P40 (A) and P60 (B) mice. The arrowheadsindicate the boundary of layer IV. All arbors are presented in coronal view, and the most complex arbors are also presented in surface view after a 90° rotation along an axis passing through layer IV (mo2a, mo2g, mo4b, mo4c, insets). Theline above coronal views indicates the pial surface. The scale is for all arbors.

