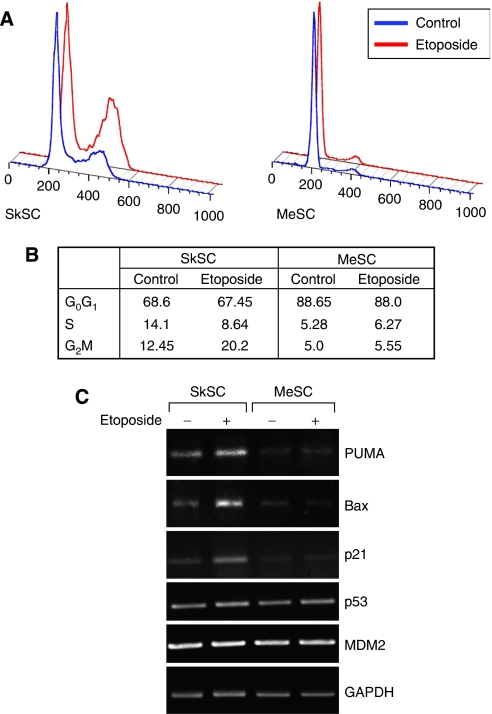
Figure 5.
MeSC fail to arrest in G2 after etoposide treatment. (A) Cells treated with 1 μM etoposide were analysed by FACS 24 h later. Note the larger G2 peak on the histogram in etoposide-treated SkSC but not in MeSC. (B) DNA histograms were analysed and the results from two experiments were averaged and are shown in the figure (numbers are per cent). (C) Semiquantitative RT–PCR analysis for p53-indicible genes in SC treated with 1 μM etoposide for 24 h.

