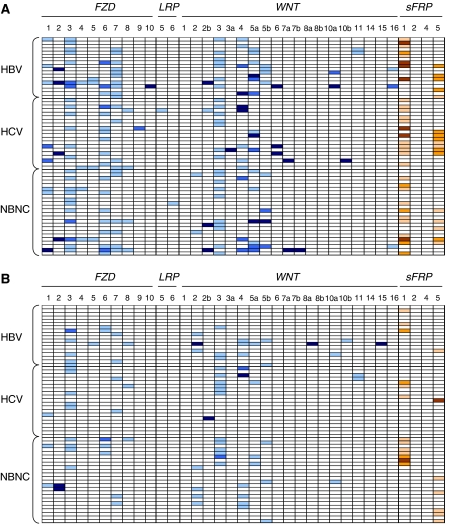
Figure 1.
Expression patterns of FZD/LRP/WNT/sFRP genes in HCC tissues in T (A) and pT (B), by comparison to cutoff values obtained from NL. Each line represents a different HCC tissue depending on the aetiologic factor (lines 1–18 for HBV, lines 19–38 for HCV, and lines 39–42 for NBNC). Upregulation of genes are indicated in coloured boxes as light blue (one- to five-fold), medium dark blue (five- to 10-fold), or dark blue (>10-fold). Downregulation of genes are indicated in pink (five-fold), orange (five- to 10-fold), or brown (<10-fold).

