
Figure 2.
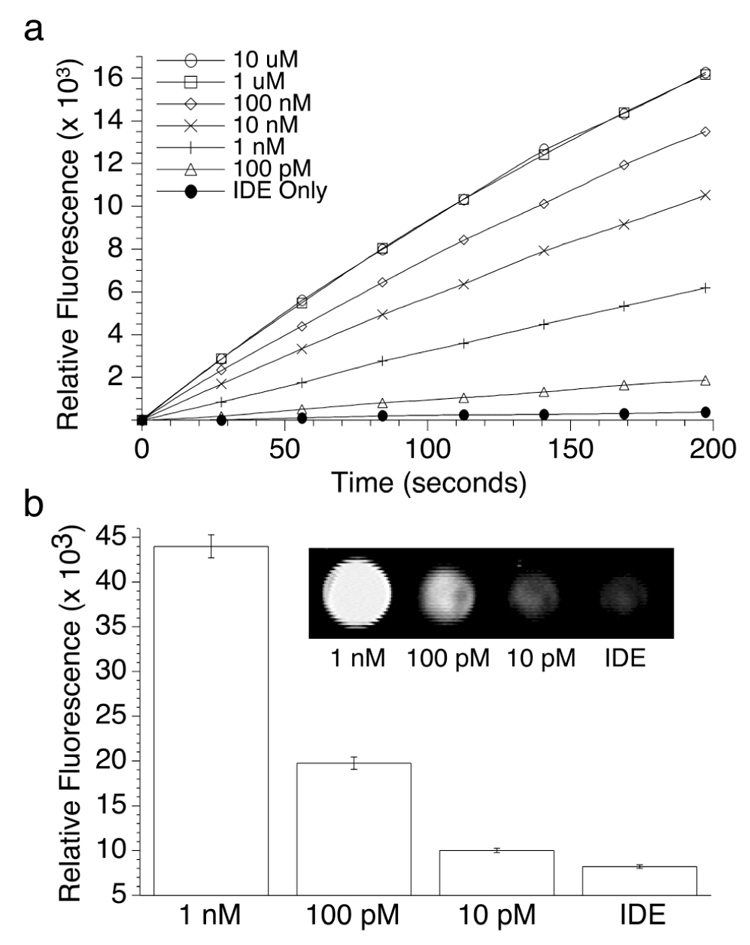
Effect of complementary DNA concentration on IDE activity. (a) Activity was measured through endolytic cleavage of substrate (40 mM) in the presence of 1.5 nM IDE (1M NaCl, 20 mM TRIS, pH 8) using a fluorescent plate reader (λex=360, λem=465). (b) Fluorescence measurements 80 minutes after addition of substrate showed a lower detection limit of 10 pM complementary DNA. Additionally, IDE activity could be visualized using a broad band UV lamp and CCD detector (inset), which has important practical applications for high-throughput screening.