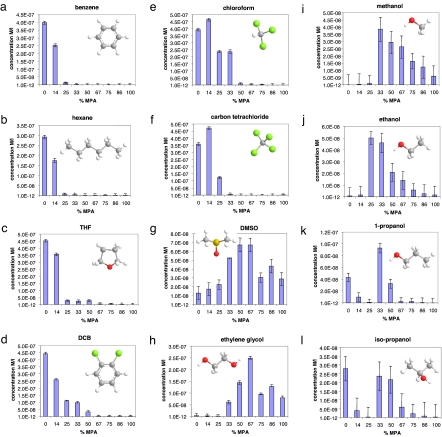
Fig. 2.
Plot of the saturation concentrations (expressed in M × l−1) for OT/MPA NPs as a function of the ligand shell composition, for NPs dissolved in various solvents: benzene (a), hexane (b), THF (c), DCB (d), chloroform (e), carbon tetrachloride (f), DMSO (g), ethylene glycol (h), methanol (i), ethanol (j), 1-propanol (k), and isopropanol (l). Error bars are the largest variation in concentration observed for different spectra on the same sample and/or on samples with the same composition prepared on different occasions (they account for instrumental, dilution, and sample-preparation uncertainties). The molecular structures of the solvents used have the following color code: carbon (gray), hydrogen (white), oxygen (red), sulfur (yellow), and chlorine (green).

