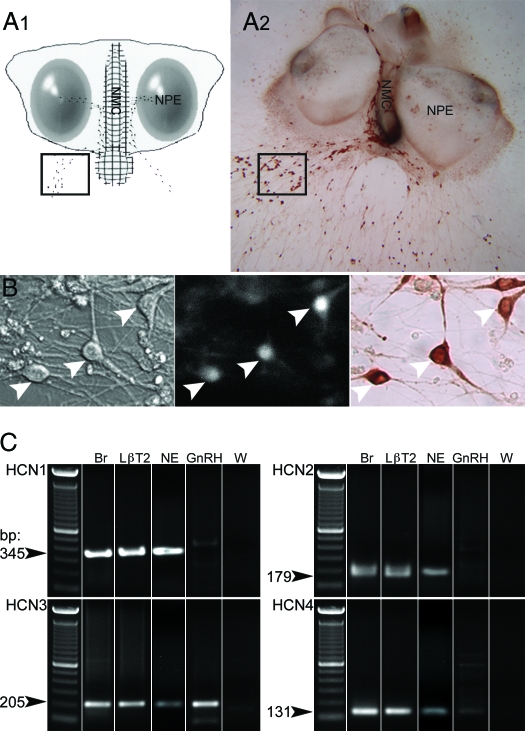
Figure 1.
Experimental conditions. Calcium imaging recordings were performed on cells maintained in mouse nasal explants for 6–10 div. A1, Schematic showing the structure of a nasal explant obtained from embryonic d-11.5 mouse and maintained 7 div, with nasal pit epithelium (NPE; ovals) and the nasal midline cartilage (NMC; meshed area), surrounded by mesenchyme. GnRH-1 neurons (dots) migrate from NPE and follow olfactory axons to the NMC and off the explant into the periphery. The boxed area delimits a typical field where cells were recorded. A2, A 9-div nasal explant immunostained for GnRH-1 (brown). B, Identified by their bipolar morphology (left panel) and loaded with a calcium-sensitive dye (middle panel), GnRH-1-like cells were recorded. The phenotype of the recorded cells was confirmed a posteriori by immunocytochemistry (right panel, brown). Arrows indicate same cells in all fields. C, Representative gel of PCR products from total nasal explant RT-PCR (NE), single-cell RT-PCR performed on GnRH-1 cells (GnRH) extracted from nasal explant using specific primers for HCN1, HCN2, HCN3, and HCN4 subunits. No bands were detected in GnRH-1 cells with HCN1- or HCN2-specific primers (n = 5). Thirty-five percent of the tested cells (n = 20) exhibited a band with HCN3-specific primers, and a weak band was observed in one of five cells with HCN4-specific primers. Adult brain (Br) and LβT2 cell line (LβT2) showed the expected band, whereas water (W) was negative.

