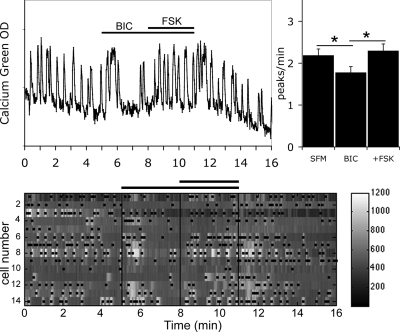
Figure 4.
BIC did not prevent FSK-induced stimulation. Recording from a single cell shows that FSK-induced stimulation occurred after removal of endogenous GABAergic inputs (GABAA antagonist BIC; 20 μm, left panel). The number of peaks per minute is significantly decreased by BIC (N = 2, n = 59) and then increased by FSK (*, P < 0.05, Student’s paired t test), showing that GnRH-1 neurons were able to directly integrate FSK-induced signals. The lower panel shows changes in intracellular calcium in 14 cells simultaneously recorded during the experimental paradigm (SFM-BIC-FSK-SFM). Each row represents changes in intracellular calcium in a single cell, and dots mark significant calcium peaks. Lines indicate the time for drug applications as shown on the single-cell trace.

