
Figure 4.
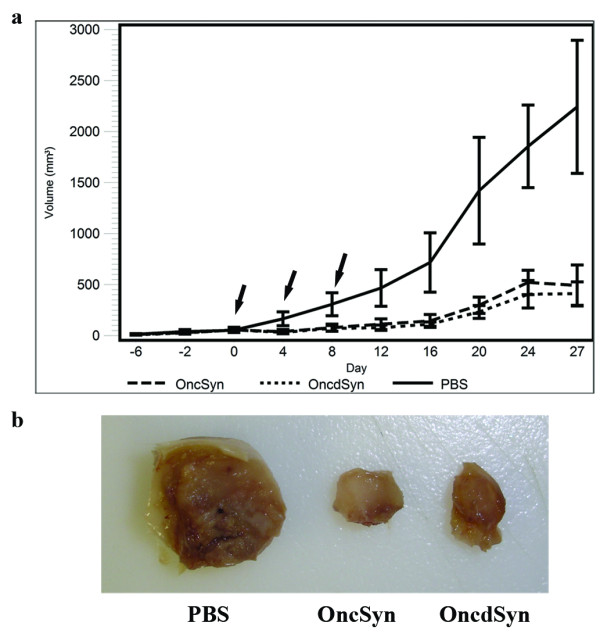
Intra-tumor treatment with OncSyn and OncdSyn viruses. (a) Balb/c mice were implanted subcutaneously in the interscapular area with 1 × 10⁵ viable 4T1 cells. Tumors were measured using a digital caliper at defined time intervals prior and after treatment (x axis). Tumors were injected with either OncSyn, OncdSyn viruses, or PBS when tumors reached approximately 80–90 mm3 in volume. Tumor volumes were measured prior to (negative values on the x axis) and after the injections. "0" on X axis represents the day of the first injection. The tumor volumes were determined from the formula: volume = (length × width × height)/2. Arrows indicate the days when therapy was administered. The error bars represent means ± 2 standard errors. (b) Tumors were excised at 42 days post implantation and visually examined. Panel shows representative tumors from virus and PBS treated animals.