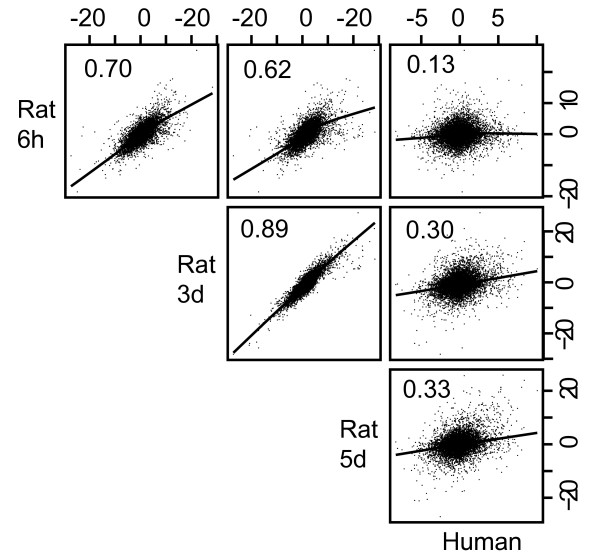
Figure 2.
Correlation of t-statistics. T-statistics were calculated for estrogen treated samples vs. control (see Methods) for the 9093 clusters of probe sets for both human and rat tissues. Scatter plots of the t-statistic for each gene are shown. Numbers represent correlation coefficients for each respective pair of samples.

