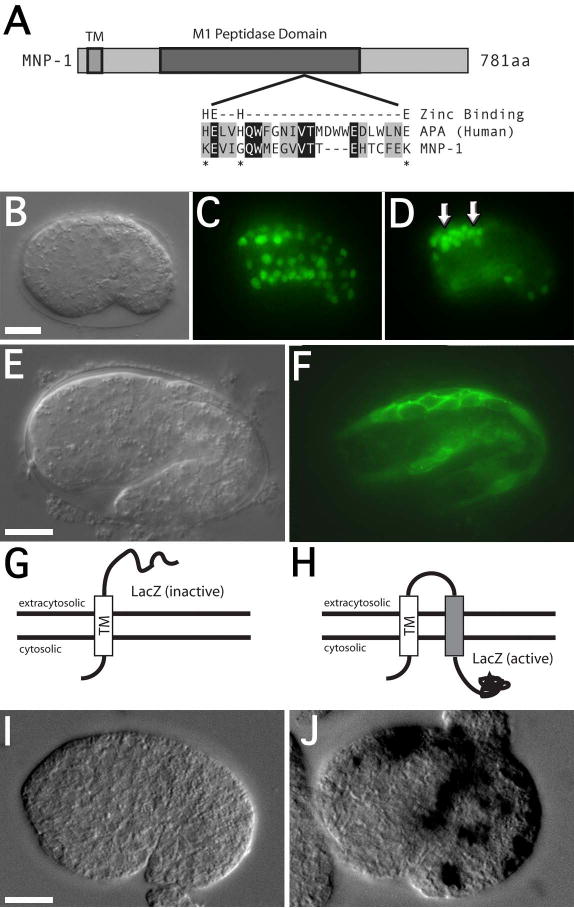
Figure 5. Expression analysis of MNP-1.

(A) Schematic representation of the MNP-1 domain structure, including an alignment of the predicted zinc-binding domains between aminopeptidase A (APA) and MNP-1. This alignment highlights the lack of conservation for three of the four essential zinc-binding residues in the MNP-1 domain (asterisks). (B) DIC and (C-D) fluorescence images of an mnp-1p::GFP transgenic embryo at the bean stage (25°C; approximately 290 min) showing expression in muscle cells and unidentified cell bodies in the head region (arrows). The identity of the muscle cells is based on position and the relative movements of the GFP expressing nuclei during embryogenesis. (E) DIC and (F) fluorescence images of mnp-1p::mnp-1tm::GFP transgenic embryo at the 1½ fold stage (25°C; approximately 380 minutes), showing localization of GFP proximal to plasma membrane of the muscle cells. (G-H) Schematic drawings indicating the inferred location of the β-gal portion of the hybrid proteins derived from the mnp-1tm::β-gal and mnp-1tm(2x)::β-gal respectively. (I) x-gal staining in a transgenic embryo expressing the mnp-1tm::β-gal hybrid protein. (J) x-gal staining in a transgenic embryo expressing the mnp-1tm(2x)::β-gal hybrid protein. Scale bars represent 10μm.
